Every study is a choice: what to measure, what to ignore, what to control for.
But beneath every controlled experiment lies a hidden threat: the N-th Variable, that one additional factor that was left out, invisible, unmeasured… and potentially decisive. In a world where complexity defines outcomes, the most dangerous thing isn’t being wrong. It’s being almost right, while missing the variable that matters most.
And as AI and data systems evolve, we’re entering an era where those missing variables may no longer stay missing. But what happens when we start seeing them all?
The Variable That Wasn't There
Imagine this: A landmark study shows that children who grow up in multilingual households have higher cognitive performance. The policy world responds: promote bilingualism early. But ten years later, a revised analysis adds another variable, maternal stress, and suddenly the effect disappears. It wasn’t the second language. It was the calm, cognitively engaged environment of the multilingual parents. The n-th variable rewrote the story.
What if that happens in 10%, 50%, or 90% of studies?
Studies That Shifted When the n-th variable was Added
Let’s look at a few real-world examples where the N-th variable changed everything:
1. Hormone Cycles in Drug Trials
For decades, drug trials were biased toward male subjects. Why? The menstrual cycle was seen as a “confounding variable.” But that omission meant we missed critical data on how dosages interact with estrogen and progesterone. The result: Drugs that didn’t work, or were even harmful, for half the population.
2. The Stanford Prison Experiment: Personality or Priming?
The infamous study led to conclusions about how quickly people conform to roles. But years later, leaked recordings and follow-up analysis introduced a new variable: researcher priming.
The guards were coached to behave aggressively. Add that variable, and the moral weight of the experiment shifts.
3. Education Outcomes and Lead Exposure
Education researchers once tied poor academic performance to poverty. But when longitudinal studies layered in blood lead levels, a new picture emerged: cognitive impacts were highly correlated with environmental toxins, not just economic deprivation.
The economic circumstances might be a pre-cursor to the environmental toxin but the poverty in and of itself wasn’t the specific attribution to poor academic performance. The N-th variable was a molecule.
4. Social Media’s Impact on Mental Health
Early studies showed a mild effect.
But when researchers later controlled for time of day, sleep cycles, and social context of use, the findings became more nuanced: doomscrolling at night alone hits differently than group chats midday.
Same app. Different outcome. One variable away from truth.
The CIA World Factbook Isn’t Just Data, It’s a Variable Map
Now let’s zoom out.
Have you ever browsed the CIA World Factbook? On the surface, it’s a bunch of stats: birth rates, electricity usage, religion breakdowns. But to systems thinkers, it’s not noise, it’s a signal layer. Each of those variables becomes a node in a mental model of a country’s internal wiring.
Want to predict social unrest? Look at youth bulge, food import dependence, internet penetration, and unemployment.
Want to build infrastructure partnerships? Cross-reference energy imports, urbanization, and language availability for training materials.
For the average reader, it's trivia. For a systems thinker, it’s context scaffolding.
This is what the N-th Variable looks like when scaled up: multiple inputs quietly shaping macro outcomes, often without attribution.
Confounding Isn’t New, but Mapping It Has Limits
The idea that unmeasured variables distort outcomes isn’t new. Researchers have long grappled with confounding variables those hidden influences that quietly disrupt the causal thread between what we observe and what’s actually true.
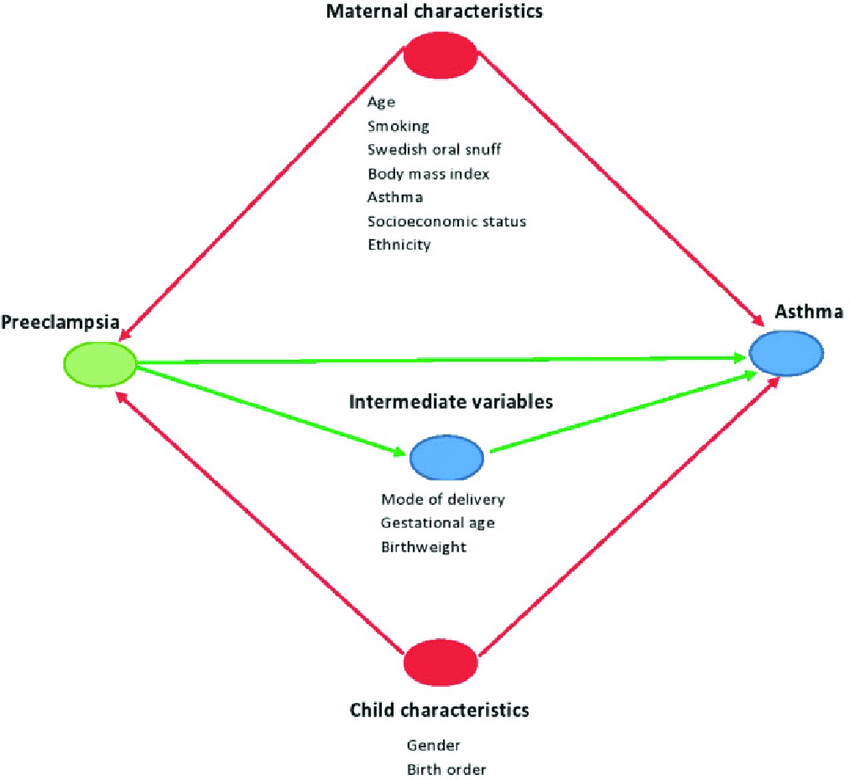
One of the most powerful tools for visualizing this complexity is the Directed Acyclic Graph (DAG). In epidemiology and social sciences, DAGs help map how different variables relate to each other, clarifying when and where confounding might arise.
Take this diagram from a landmark paper in International Journal of Epidemiology (2021), where a DAG helps illustrate how exposure, outcomes, and intervening variables interact in a complex study setup:
Directed Acyclic Graph (DAG) showing confounders in a causal study
“DAGs help untangle causal logic but they’re only as good as the variables we know to include.”
But that’s the problem: DAGs don’t reveal the N-th variable… they only organize what we’ve already considered. And often, it’s what we haven’t considered that changes the outcome.
This is where modern AI begins to shift the paradigm. Unlike traditional models, AI can search for hidden structure, retrofit new variables into old data, and surface surprising influences no researcher thought to isolate.
What happens when the DAG becomes dynamic? When the graph redraws itself, automatically, each time new data becomes available?
That’s where we now head.
What Happens When We Stop Missing the Variable?
We are entering an era where AI doesn’t just run studies, it can remix them. It can overlay previously untrackable variables, stress markers, biometric responses, behavioral nuance and rewrite the conclusions of the past.
AI doesn’t just tell us what happened.
It tells us why and what we didn’t see before.
What happens to truth, trust, and policy when no variable stays hidden? What happens when the default state is not ignorance but simulated omniscience?
That’s the threshold we’re approaching. Each new model we train reveals more of the invisible. Each variable unlocked... feels a bit more like revelation.
I’ll continue this line of thought in my next write-up of how the n-th variable is the missing element that unlocks omni-intelligence as a service.
Thanks for reading RΞIMAGINΞ! Subscribe for free to receive new posts and support my work.